
Understanding USDC Supply dynamics
The supply of USDC shifts based on macro trends, rate cycles, redemptions, and on-chain activity. The trend is constantly evolving, shaped by multiple forces — from internal ecosystem growth to broader macro conditions.
Tracking it in real time reveals early signals of liquidity flows and user demand, helping traders form sharper theses ahead of market moves.
Here’s a curated set of tools and dashboards to help you break down, forecast, and analyze USDC supply dynamics:
Platforms for Context & Market Coverage
To understand the broader context of USDC’s movement, it helps to track analysis and sentiment from multiple trusted sources. Here are a few you can rely on:
- Glassnode / Artemisxyz: Sentiment, newsflow tracking, and ecosystem adoption narratives.
- Stablewatch: Overall stablecoins relative to money supply trends.
- Circle IR / Circle Blog: Direct insights from the issuer
- Alkimiya: Predictive markets and total supply forecasts for USDC via On-chain Event calendar.
The Stablecoin Landscape: Total Supply [Artemisxyz]
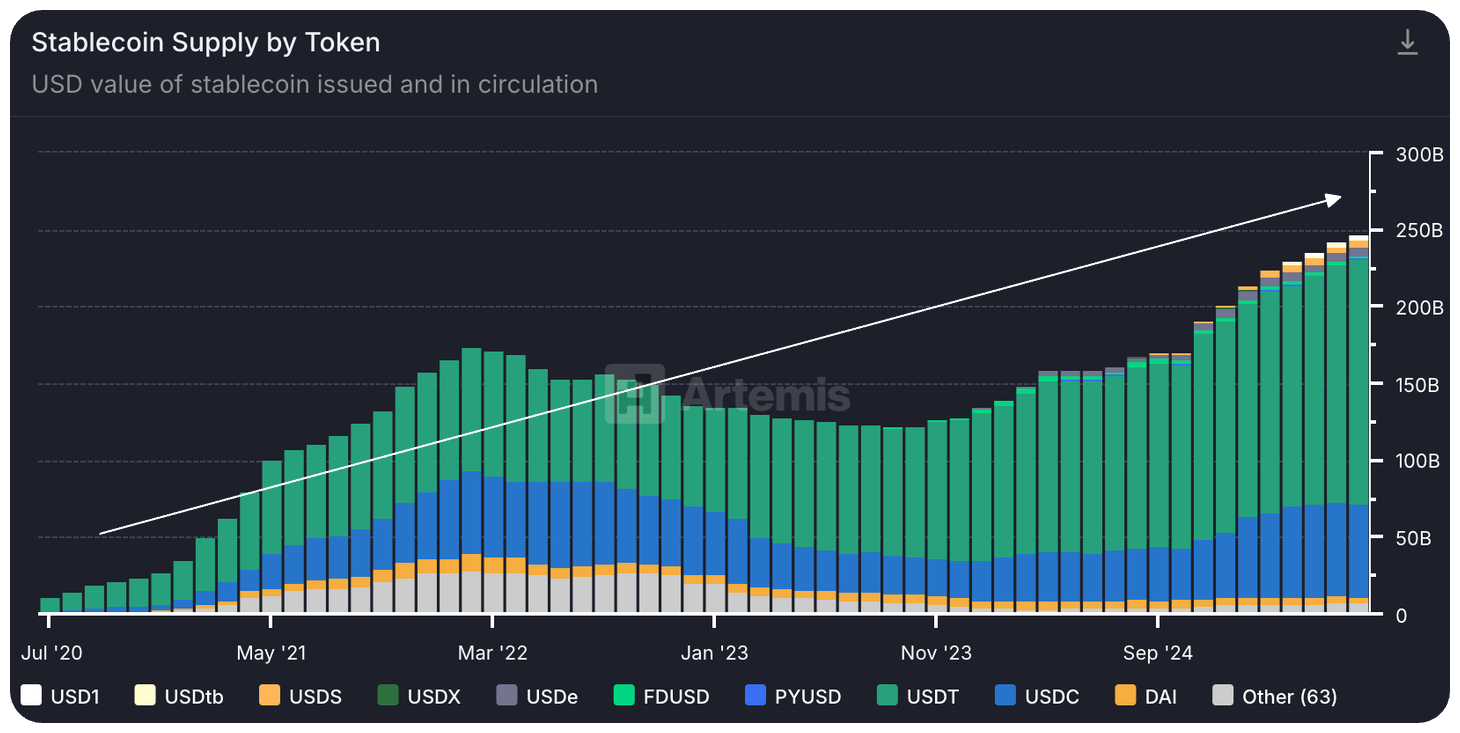
Stablecoin supply on longer timeframes reflects risk appetite and liquidity trends across the entire crypto market.
USDC currently makes up around 32% of all stablecoins in circulation, giving its supply trajectory significant influence over the overall direction of the stablecoin market.
Historical Supply Trend Overview [Glassnode]
Scoping into USDC’s native supply, the historical curve tells a clear story.
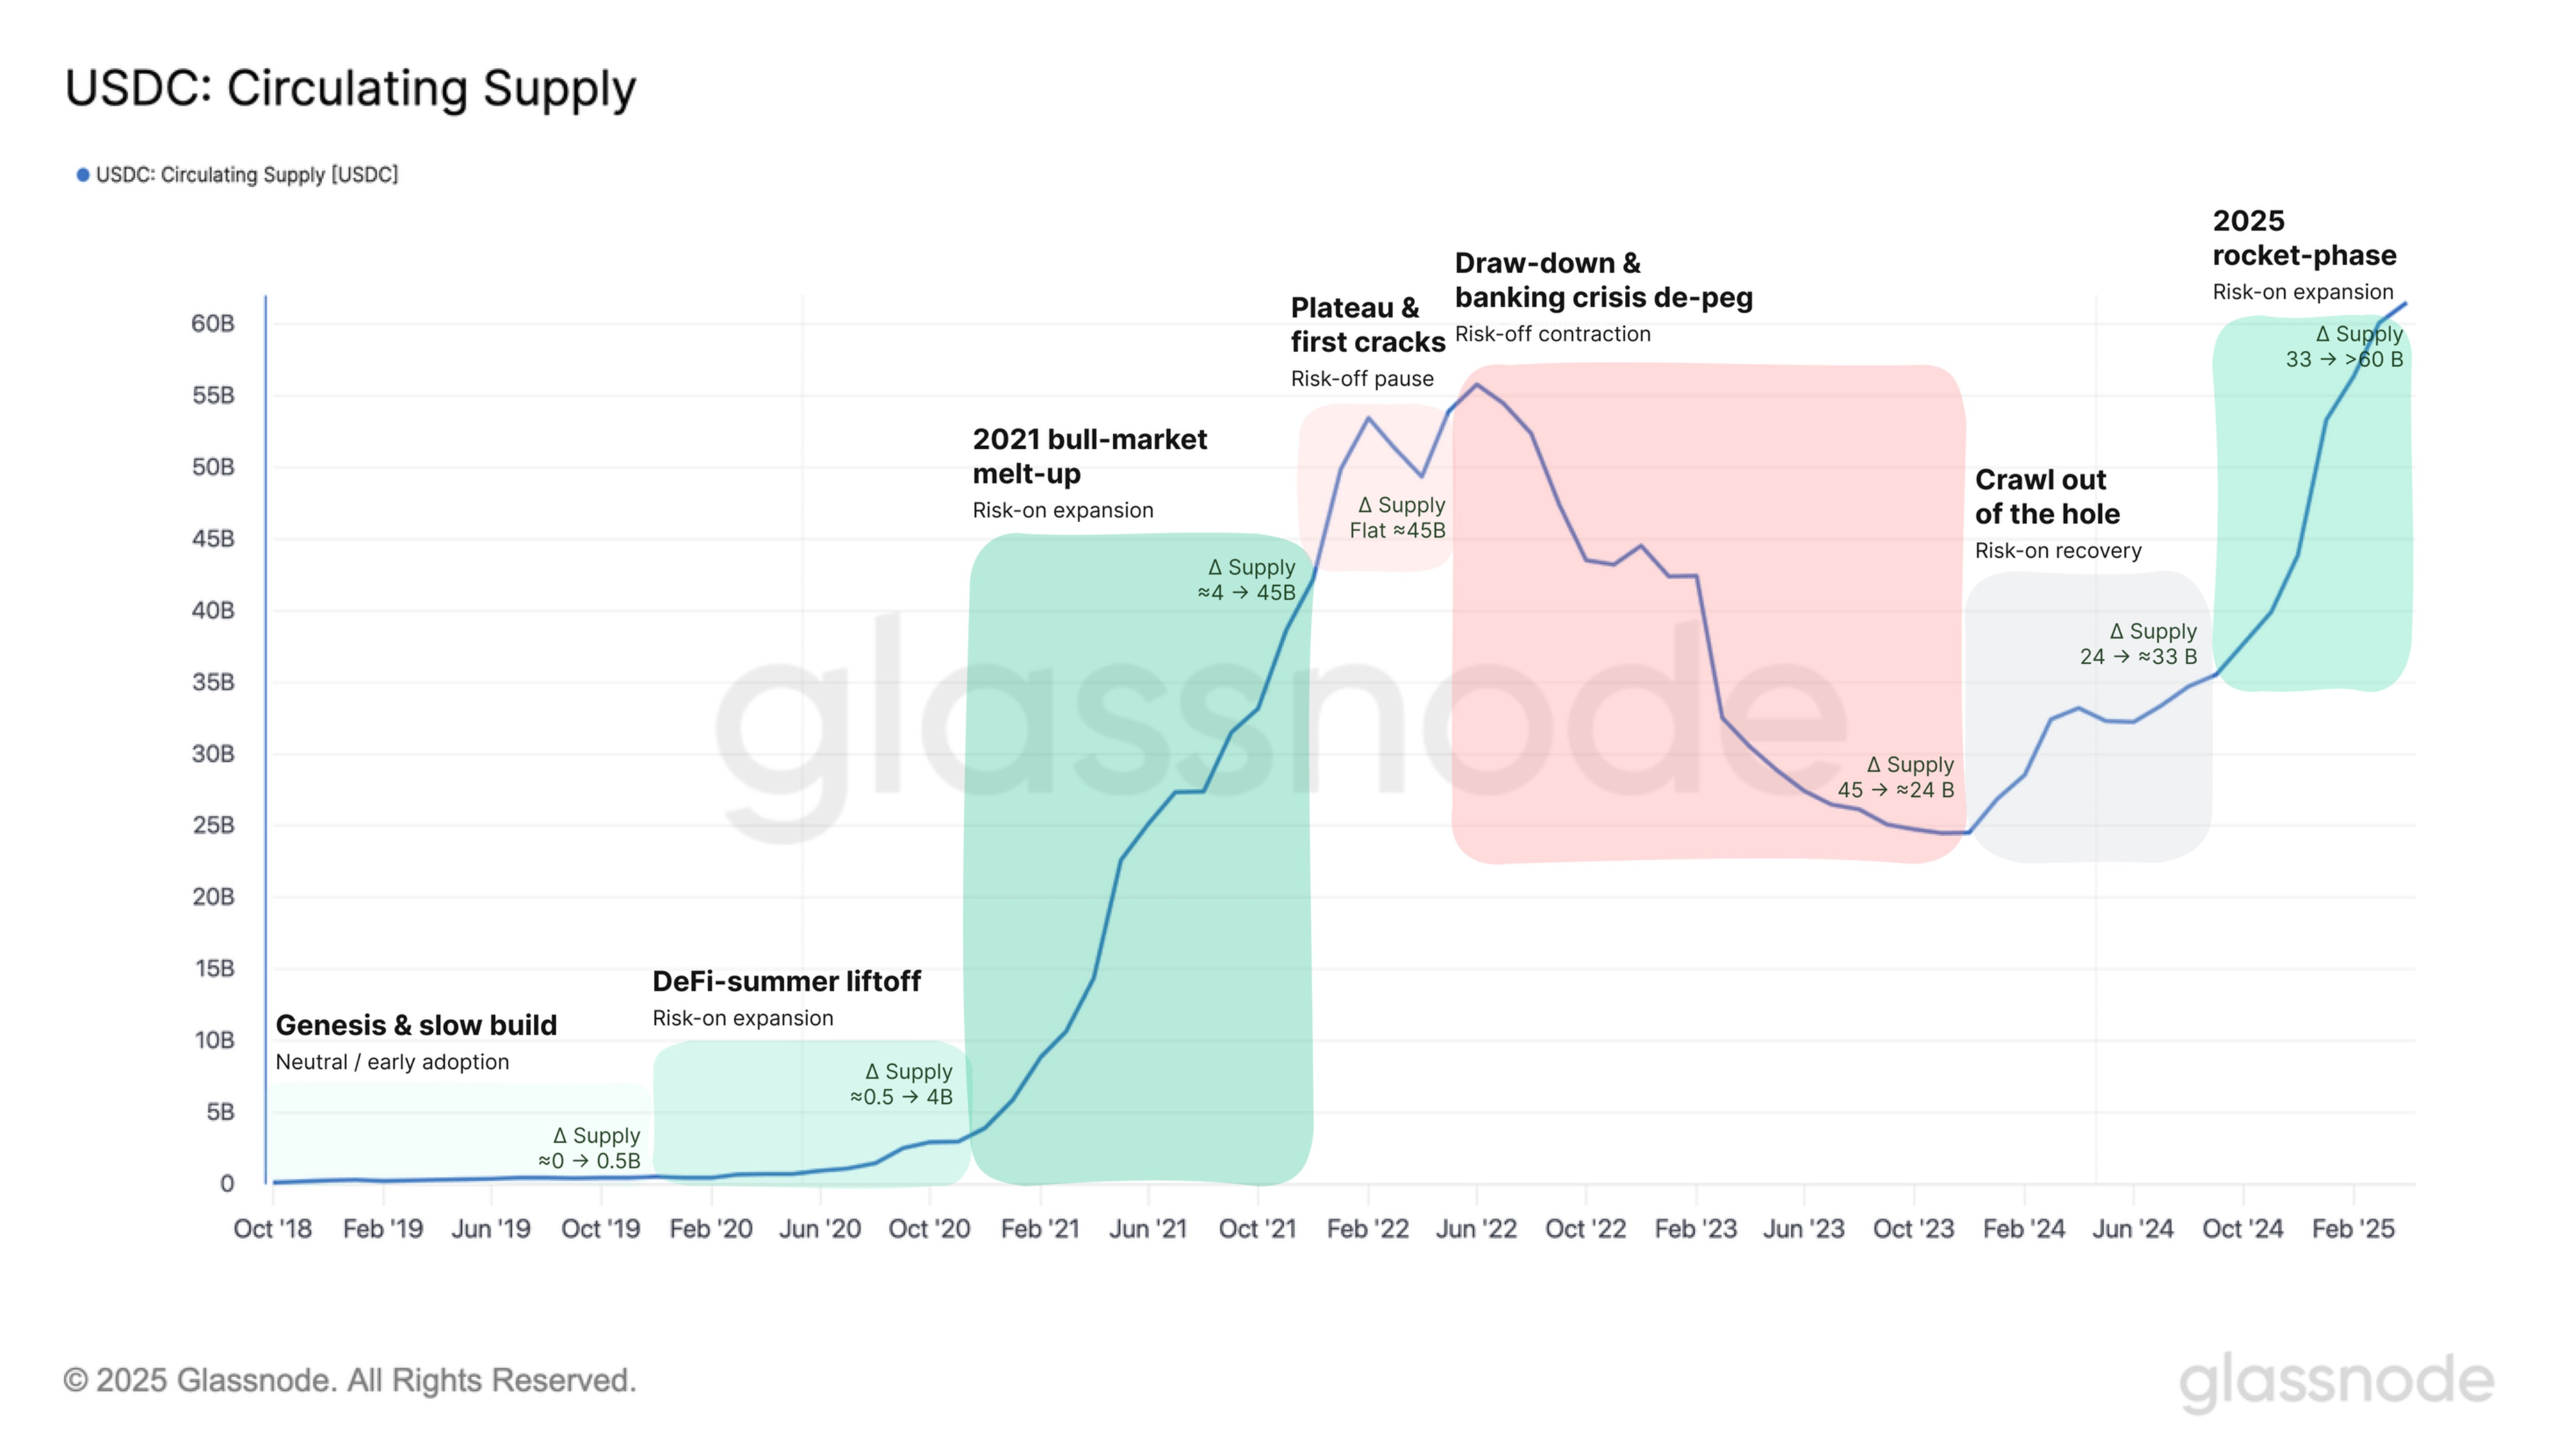
It closely tracks major crypto macro cycles, from DeFi-driven expansions to contraction during bearish sentiments and often moves ahead of the broader market.
Overtime, USDC supply has consistently served as a leading indicator of liquidity shifts and a reflection of DeFi’s adoption trajectory.
Ecosystem-Level Supply Breakdown [Artemisxyz]
As we zoom into the chain-level data, USDC’s footprint reveals a diverse and evolving distribution across ecosystems.
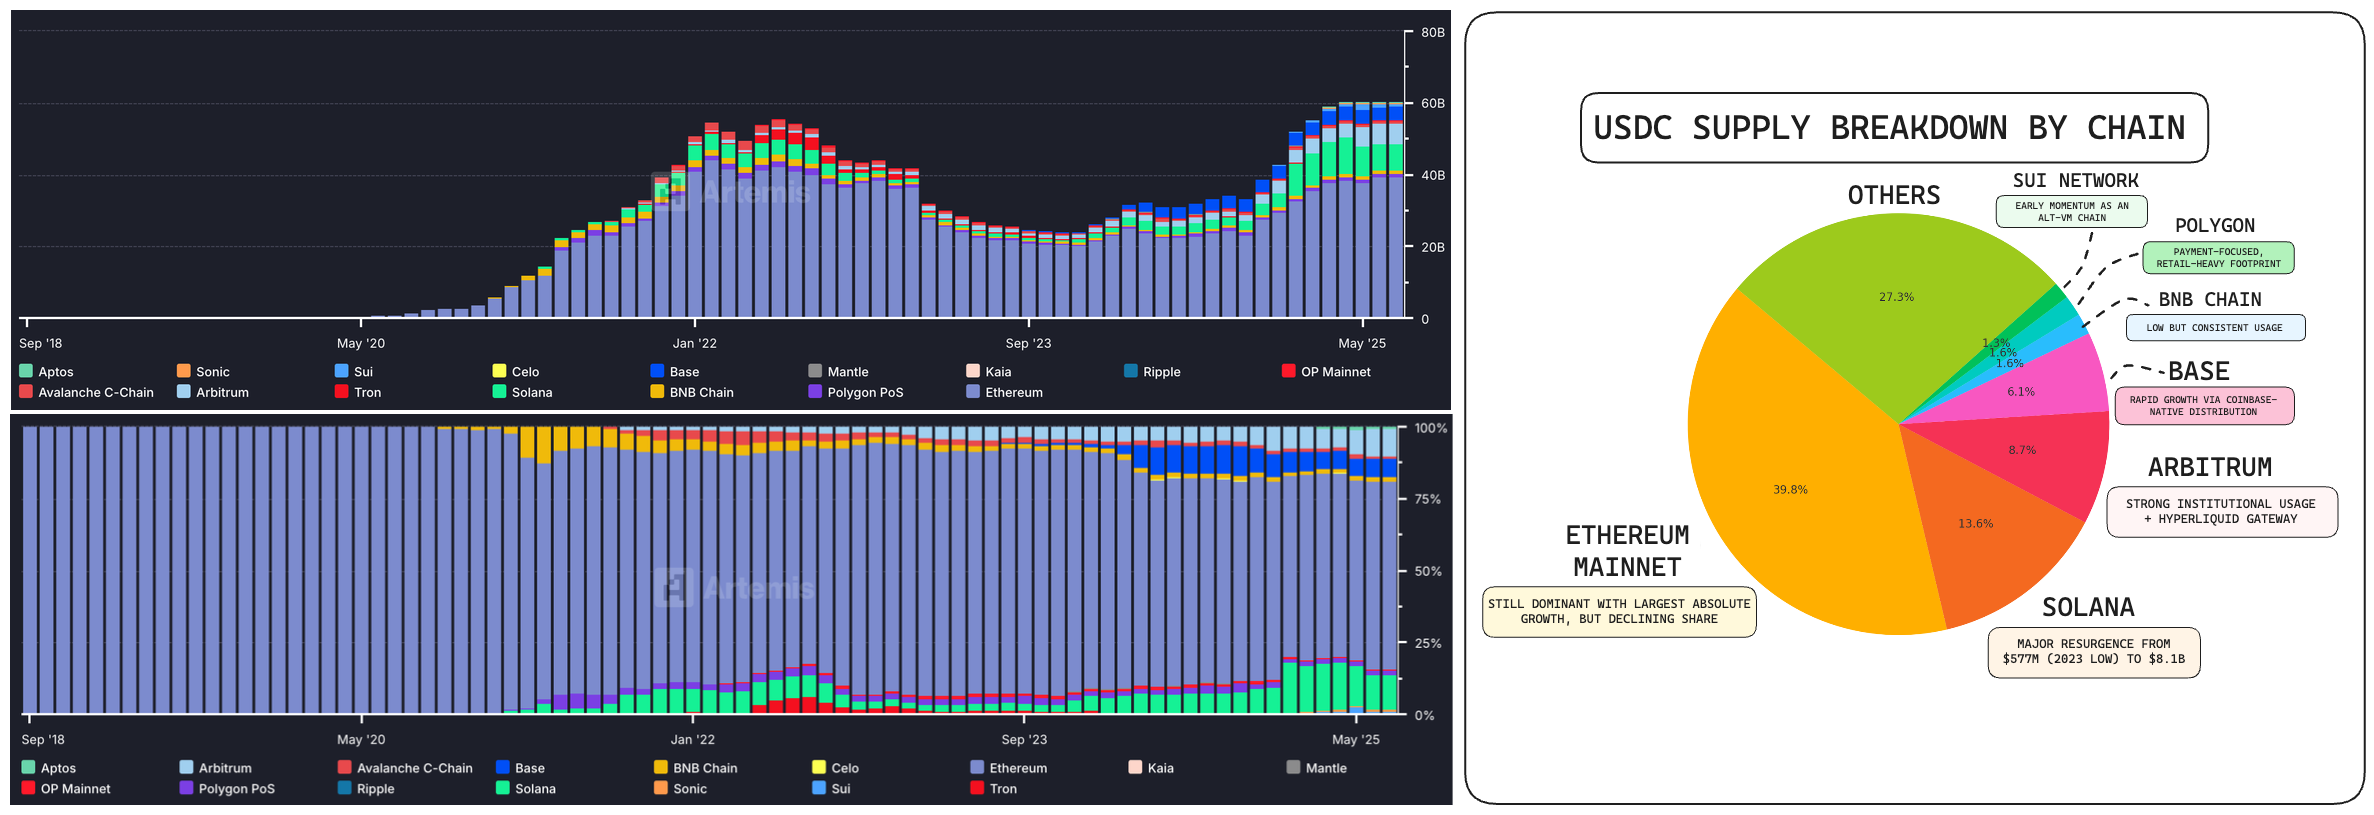
USDC is no longer concentrated solely on Ethereum. Its supply is now spread across Layer 2s like Arbitrum and Optimism, as well as alt-VM chains like Solana. This horizontal expansion aligns closely with where liquidity, activity, and on-chain utility are growing fastest.
Ecosystem Specific Dynamics [Artemisxyz]
Each ecosystem has its own unique stablecoin dynamics, shaped by factors like gas costs, user behavior, protocol incentives, and bridge infrastructure.
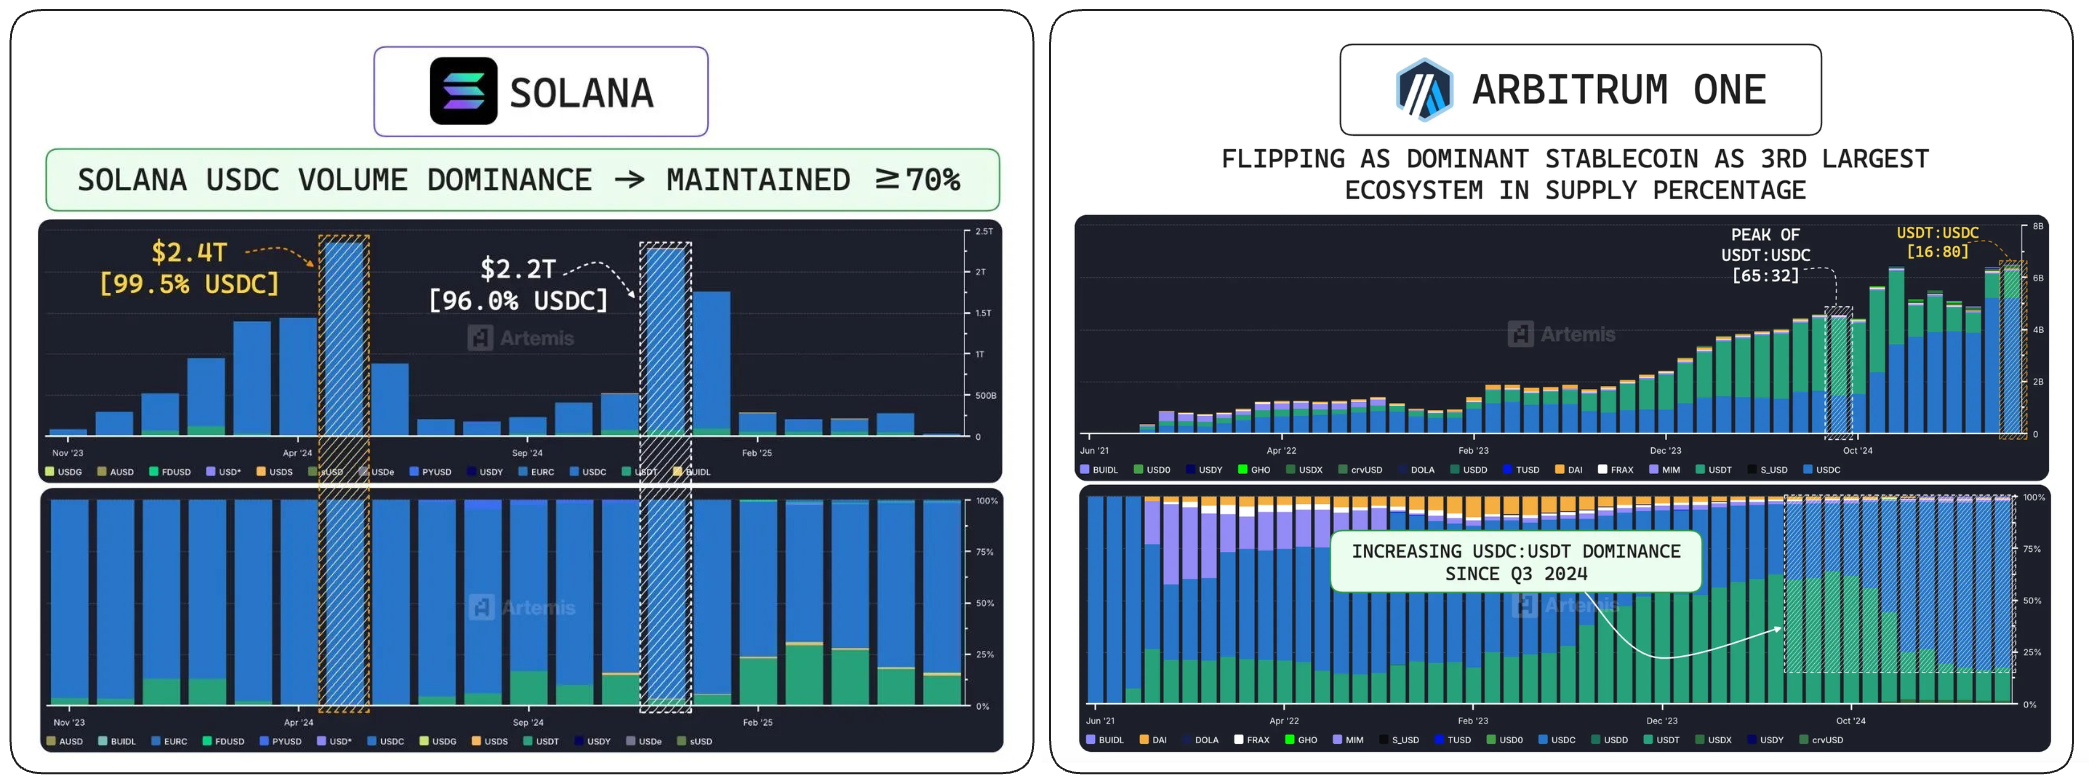
For example:
- Solana: USDC accounts for the overwhelming majority of stablecoin volume (averaging often above 95%).
- Arbitrum: USDC overtook USDT in late 2024, marking a structural shift in user preference and protocol-level adoption.
Catalytic events native to ecosystems can trigger rapid spikes in USDC supply within specific ecosystems. These localized shifts often roll up into broader supply expansions visible at the macro level.
By tracking where USDC supply is minting most aggressively, we gain deeper insight into which chains are driving demand and which ecosystems may be early signals of broader liquidity cycles.
Indirect Metrics Influencing Future Trajectory
Total Transfer Volumes & Daily Active Users (DAUs) [Artemisxyz]
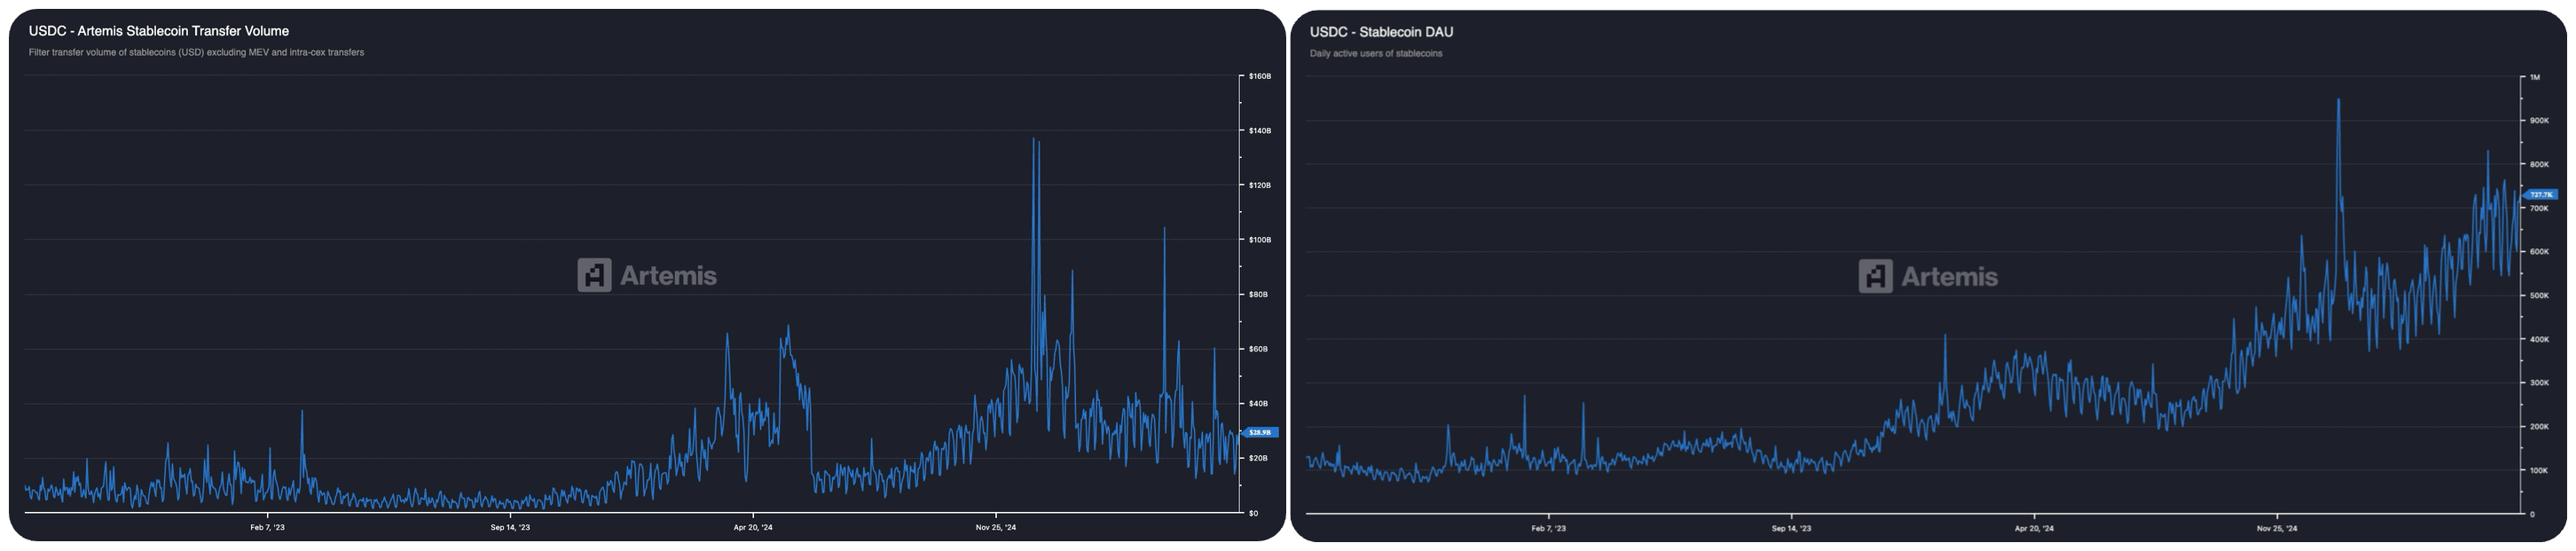
While mint and redemption flows determine USDC’s net supply, indirect usage metrics often leading trends that forecast a potential directional supply change.
Two fundamental key indicators to watch:
- Daily Active Users (DAUs): A rising user base signals broader adoption and sustained demand.
- Total Transfer Volume: Increasing volume reflects deeper liquidity usage and higher transaction intensity.
These metrics often front-run actual supply changes. For instance, a sharp rise in USDC DAUs on Arbitrum was observed weeks before the ecosystem's stablecoin flippening, where USDC overtook USDT in dominance.
Beyond Adoption Metrics
Additional useful metrics for consideration include:
- Wallet churn rate: Measures the ratio of new vs. returning wallets, offering insight into user growth and retention.
- Unique contract interactions: Highlights how actively USDC is being used across DeFi protocols and applications.
- Exchange balance changes: Tracks USDC flowing into or out of centralized venues — often a signal of risk-on/off behavior.
- Interop services & bridge integrations: The rollout of USDC on major bridges (e.g. LayerZero, Wormhole, CCTP) can unlock new mint pathways and liquidity routes across chains.
- Native integrations in established ecosystems: Direct USDC support at the protocol or network level (e.g. Solana, Arbitrum, Base) often precedes localized supply spikes.
- Emerging narrative alignment: New demand driven by fast-growing sectors like real-world assets (RWA), on-chain treasuries, or institutional settlement can create sticky long-term mint pressure.
These factors, while indirect, often act as early signals of where supply momentum is building. Having more information always offer sharper foresight before changes appear in headline supply metrics.
There’s no single formula. Instead, a combination of metrics, narratives, and chain-specific signals can be used to construct high-conviction theses around upcoming supply shifts.
Updated about 1 year ago